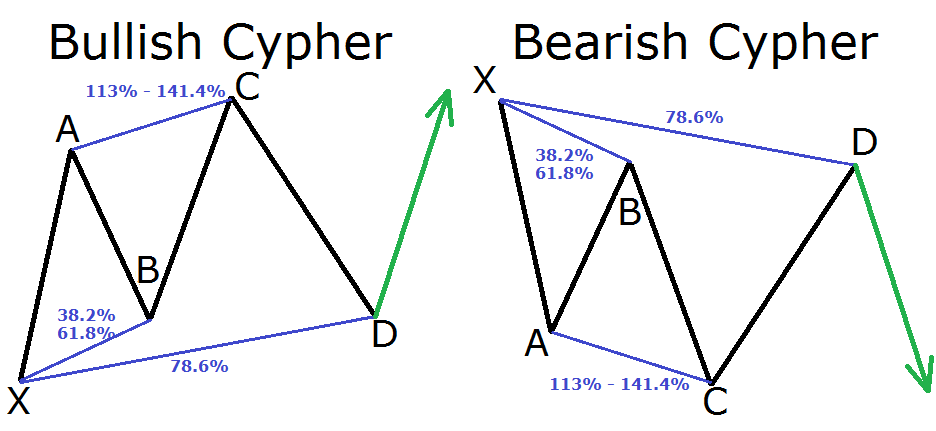
Do you want to figure out if some possible areas of the overall trend have the potential for continuation? Harmonic price patterns might be of help to you, and we have six types of them. Let us enumerate them one by one:
- The ABCD pattern
- The three-drive pattern
- The Gartley pattern
- The crab pattern
- The bat pattern
- The butterfly pattern
These patterns can be challenges to spot, but once you do, there is an excellent possibility that you can take home a hefty amount of profits because they can help traders pinpoint potential recent trend retracement. However, before anything else, know that learning about the Fibonacci retracements and extensions will be vital for this topic. Spotting harmonic price patterns can help identify possible areas where the overall trend tends to continue.
Three steps to recognize these harmonic price patterns
Harmonic price patterns are notorious for being hard to find because they are too perfect. You will need a pair of alert eyes and a lot of patience to spot these patterns and avoid entering a trade before the completion. It might be too much of a challenge at first, but the more you gain experience, the better it gets. Here is a 3-step summary of what you need to do:
- Step number 1: Locating possible harmonic price patterns
- Step number 2: Measurement of possible harmonic price patterns
- Step number 3: Buying or selling of the harmonic pattern after completion
Explaining the steps further
For the first step, we need to locate the possible harmonic price patterns. After that, we need to measure them. With the help of the Fibonacci tool, we need to observe and analyze the possible harmonic price patterns that we located. Here is how we do it:
- Move BC should be Move AB’s 0.618 retracement.
- Move CD should be move BC’s 1.272 extension.
- AB’s length should be equal to or at least equal to CD’s length.
If the patterns you located and measured fit these qualifications, this can pass as a bullish ABCD pattern. It is a strong buy signal.
Now for the final step! As the harmonic price pattern that we located and measured complete, you only need to reply to the buy and sell orders placed. In line with our previous example, you will need to buy at point D since it is move CB’s 1.272 Fibonacci extension. Take note that you should place a stop-loss order just a few pips under the entry price.
Does it sound and look easy?
It may seem that way, but it may not be when you are already executing it. We guess that is how most things work, right? They say that there are no perfect things in this world. If there are, at least there are only a few of them, and these harmonic price patterns happen to be one of those. Since they are perfect, it would be reasonable that they are hard to find. But once you do, you might have hit the jackpot right then and there.


